
 2025-02-07
 PODCAST
 share
Plants are continuously exposed to environmental stresses that affect their growth, development and yield. Drought, extreme temperatures, salinity and nutrient deficiencies are common abiotic pressures. Pests and pathogens add biotic stress. For growers, the challenge is recognizing a meaningful change early enough to investigate it. Plant stress detection combines field observations, sensor measurements and AI-assisted analysis.
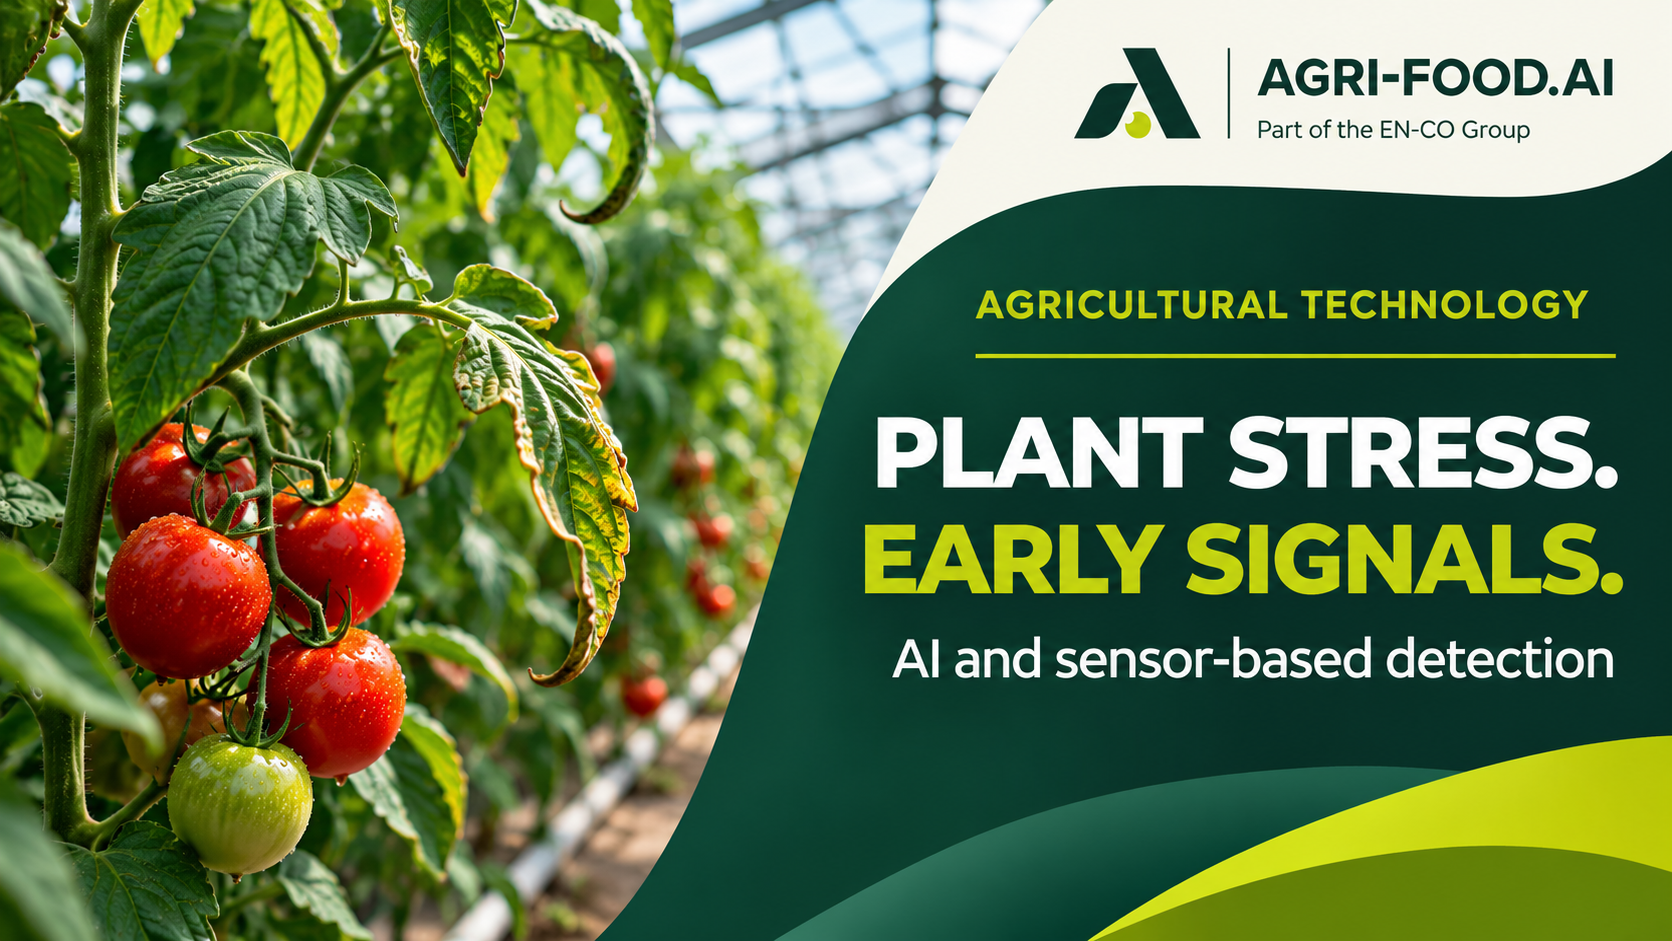
How plants respond to environmental stress
During drought, plants may close their stomata to reduce water loss. This also limits carbon dioxide uptake and can slow photosynthesis. Heat can disrupt cellular processes, while salinity makes water uptake and ion balance harder to maintain. Hormones such as abscisic acid regulate these responses, and antioxidant systems help protect plant cells.
The response depends on crop species, growth stage and exposure. Physiological changes may begin before leaves visibly wilt, and the same pressure can produce different symptoms under different growing conditions.
Which signs can reveal plant stress?
Wilting, leaf curling, yellowing, scorched edges and slower growth are reasons to inspect a crop. Yet similar symptoms may have different causes. Yellow leaves can point to nutrient deficiency, root problems or disease. Higher leaf temperature can accompany reduced transpiration, but direct sunlight and weather also affect it.
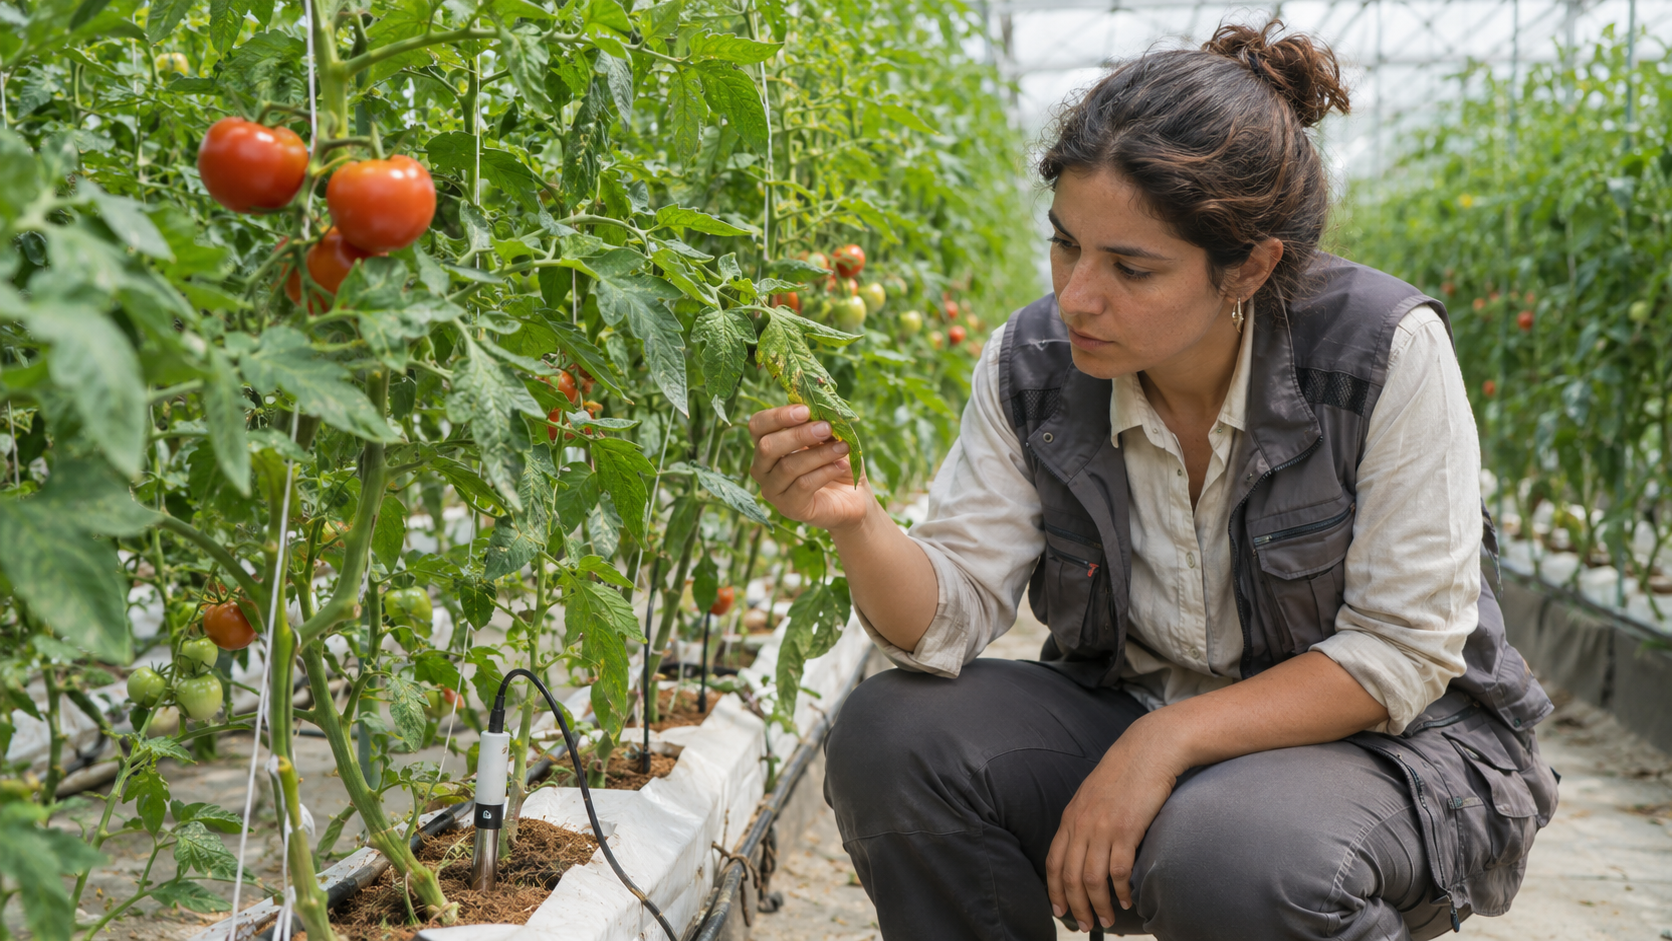
Note where the symptoms appear, when they began and whether nearby plants look different. Irrigation logs, recent temperatures and checks for pests or damage help interpret what a sensor detects.
How sensors support plant stress detection
Multispectral cameras measure reflected light in selected wavelength bands. The Normalized Difference Vegetation Index (NDVI) compares red and near-infrared reflectance to describe vegetation greenness. Healthy green leaves absorb much of the red light and reflect near-infrared light, as NASA explains in its guide to vegetation indices. NDVI can highlight areas for inspection, although soil background, canopy coverage and clouds affect the result.
Thermal cameras reveal differences in canopy surface temperature that may relate to transpiration and water status. Air temperature, humidity, wind and sunlight also influence readings. After dark adaptation, chlorophyll fluorescence measurements such as Fv/Fm assess the maximum efficiency of photosystem II. Hyperspectral imaging captures finer spectral variation but requires careful calibration and interpretation.
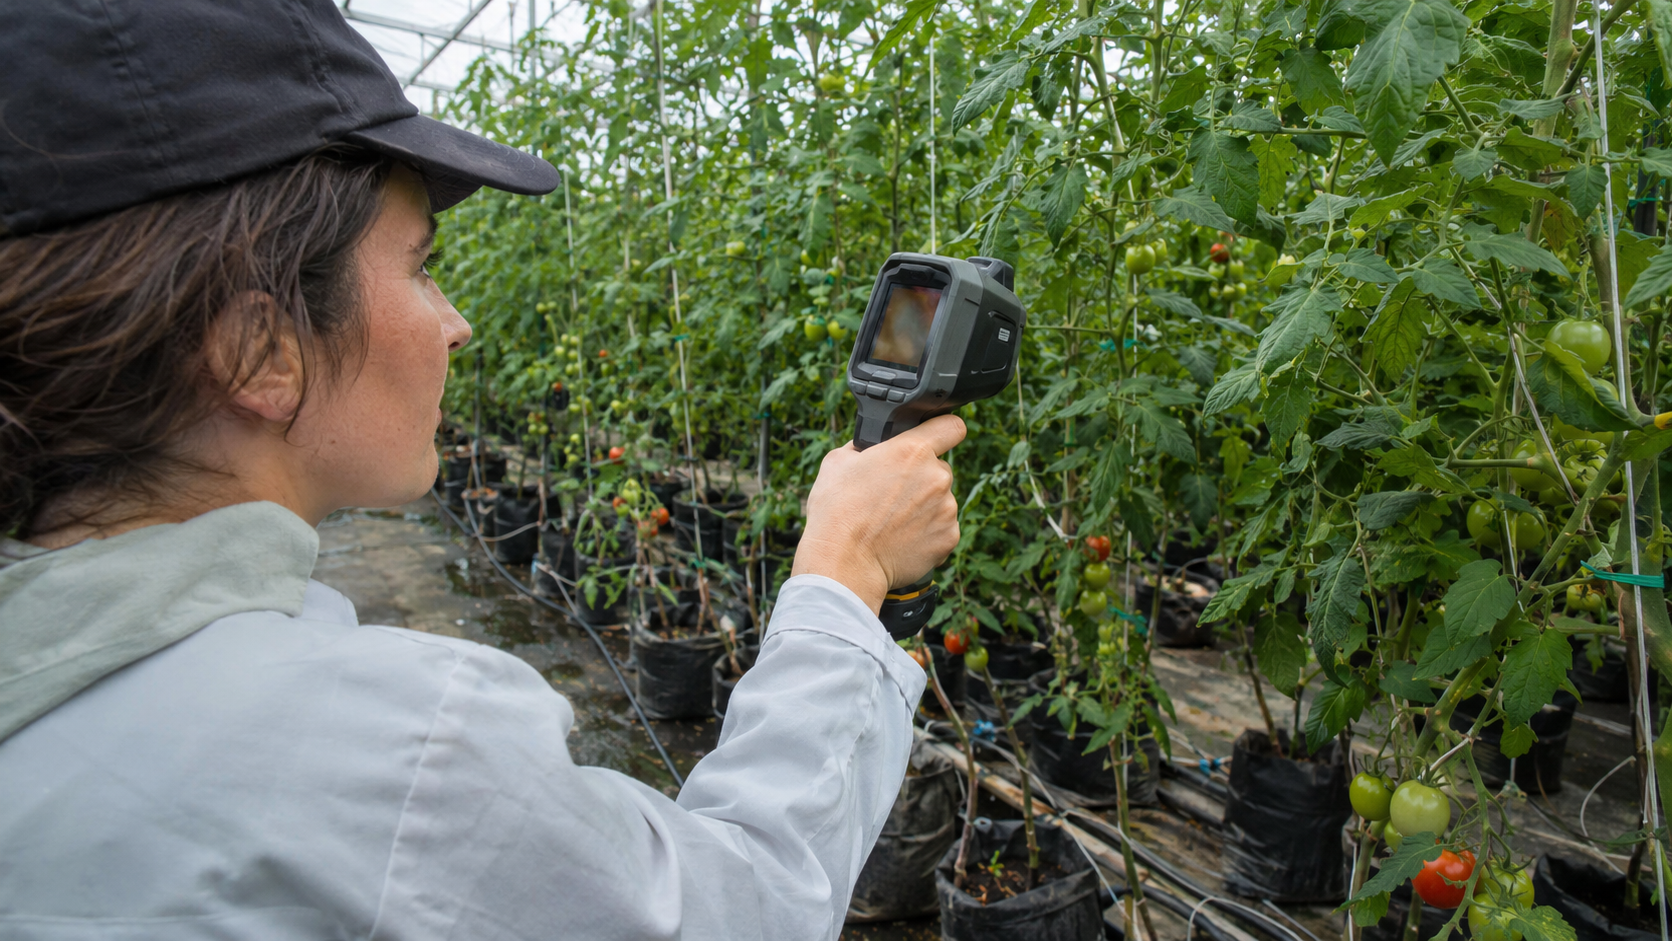
Each method measures a different signal. Reliable sensor data collection helps put readings alongside environmental records, provided timing and calibration are consistent.
What AI can tell us about plant stress
AI models can compare crop images and sensor readings over time to flag unusual patterns. A warmer canopy combined with changing spectral reflectance may identify an area worth investigating. The interpretation still depends on crop variety, weather and reference data.
A systematic review of 262 studies on imaging sensors and AI identifies challenges in data collection, sensor choice and analysis. Performance can change when lighting or crop growth differs from the training data. Combining thermal and spectral measurements may help if the model is validated under those conditions. A sensor alert alone cannot establish the cause. If a greenhouse camera flags a warmer area, check drip lines, ventilation and nearby plants before changing irrigation.
In greenhouses and vertical farming facilities, climate and irrigation logs provide useful context for interpreting crop images.
What to check before taking action
When a sensor suggests possible crop stress, start with three checks.
- Compare the signal with a suitable baseline for the same crop, growth stage and measurement conditions.
- Review irrigation, weather, soil or substrate conditions and the location of visible symptoms.
- Inspect affected plants and, where necessary, use field or laboratory tests to investigate the suspected cause before changing treatment.
Plant stress detection is useful when a measurable signal leads to a specific field check. AGRI-FOOD.AI applies agricultural image analysis in products such as Maduro, which assesses harvested coffee cherry ripeness. Crop stress monitoring is a different application and requires its own data and validation. To discuss a custom sensor or machine-vision project, contact AGRI-FOOD.AI with your crop, growing environment and available measurements.

Could sensor and camera data help your team investigate possible crop stress? Share your crop, growing conditions and available measurements to discuss a suitable monitoring approach.
2025-02-07


 Our website uses cookies