
 2026-11-11
 PODCAST
 share
Your broiler average is on target and collection is approaching. Before confirming the plan, check what that average hides. Two houses can reach the same mean weight with very different numbers of light and heavy birds. Broiler weight distribution helps you see that spread.
Why broiler weight distribution changes the plan
A processing partner may require birds within an agreed weight band. However, an average inside that band gives no count of the birds outside it. Their share can affect collection planning and payment, depending on the buyer’s requirements.
For example, a compact spread and a broad spread can have the same centre. First agree the buyer’s weight range, then examine how the observed weights sit around it. Daily broiler weight monitoring shows the growth trend, while the distribution adds information about variation.
Read the histogram before trusting the average
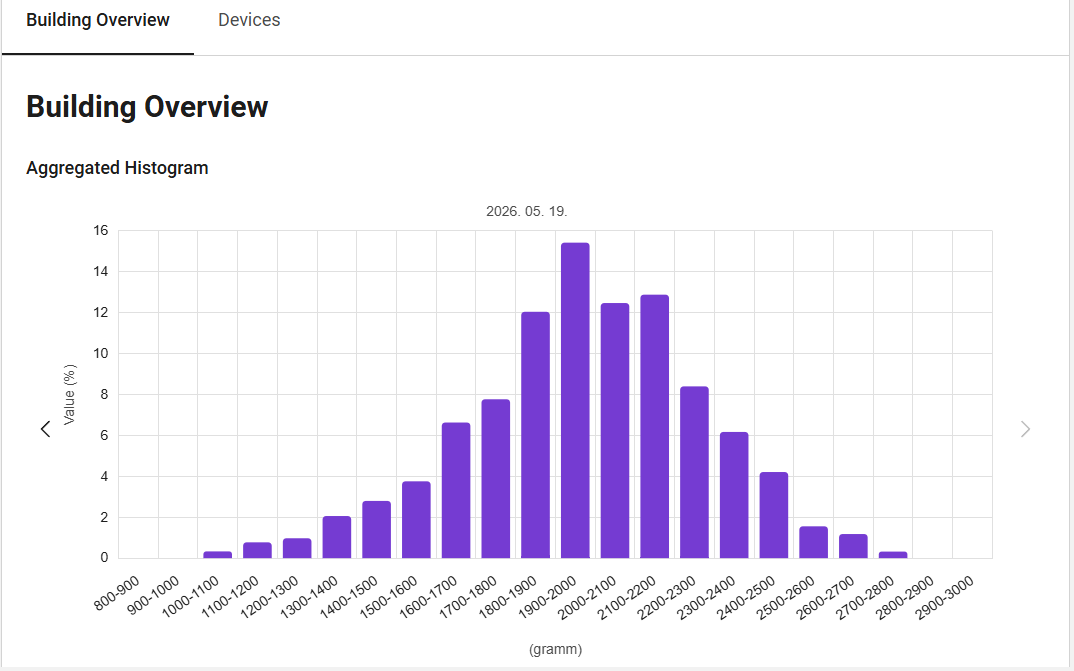
ChiCams by AGRI-FOOD.AI estimates broiler weight from camera images and processes images locally. MoniTwin provides daily records and charts. A supplied ChiCams report illustrates broiler weight distribution in 100 g bands. Each bar shows the frequency of observations in a weight band.
Read the spread alongside the coefficient of variation (CV%), which expresses variation relative to the average. A lower CV% means less relative variation in the sample. To calculate CV%, divide the standard deviation by the mean and multiply by 100. CV% is different from the percentage of birds inside a target band.
If a chart has two peaks, investigate flock grouping, sex and sampling conditions before drawing a conclusion. The shape alone does not identify the cause.
Because the camera sees a defined area, its observations need checking against the wider flock. Keep the date, sample size and camera location with the chart. Also keep a valid daily estimate separate from the forecast. When there are too few usable images for a new estimate, the forecast can continue from the last valid day.Example from ChiCams development material showing 100 g weight bands. The chart illustrates a distribution and does not establish accuracy.
What three reference checks actually show
When assessing broiler weight distribution, check the average against a reference too. Three batch comparisons published by French partner GWELLIT report ChiCams estimates and slaughterhouse reference averages. The signed differences below mean estimate minus reference, with percentages calculated against the reference.Three published batch-average comparisons. These results do not validate individual weight bands or CV%.
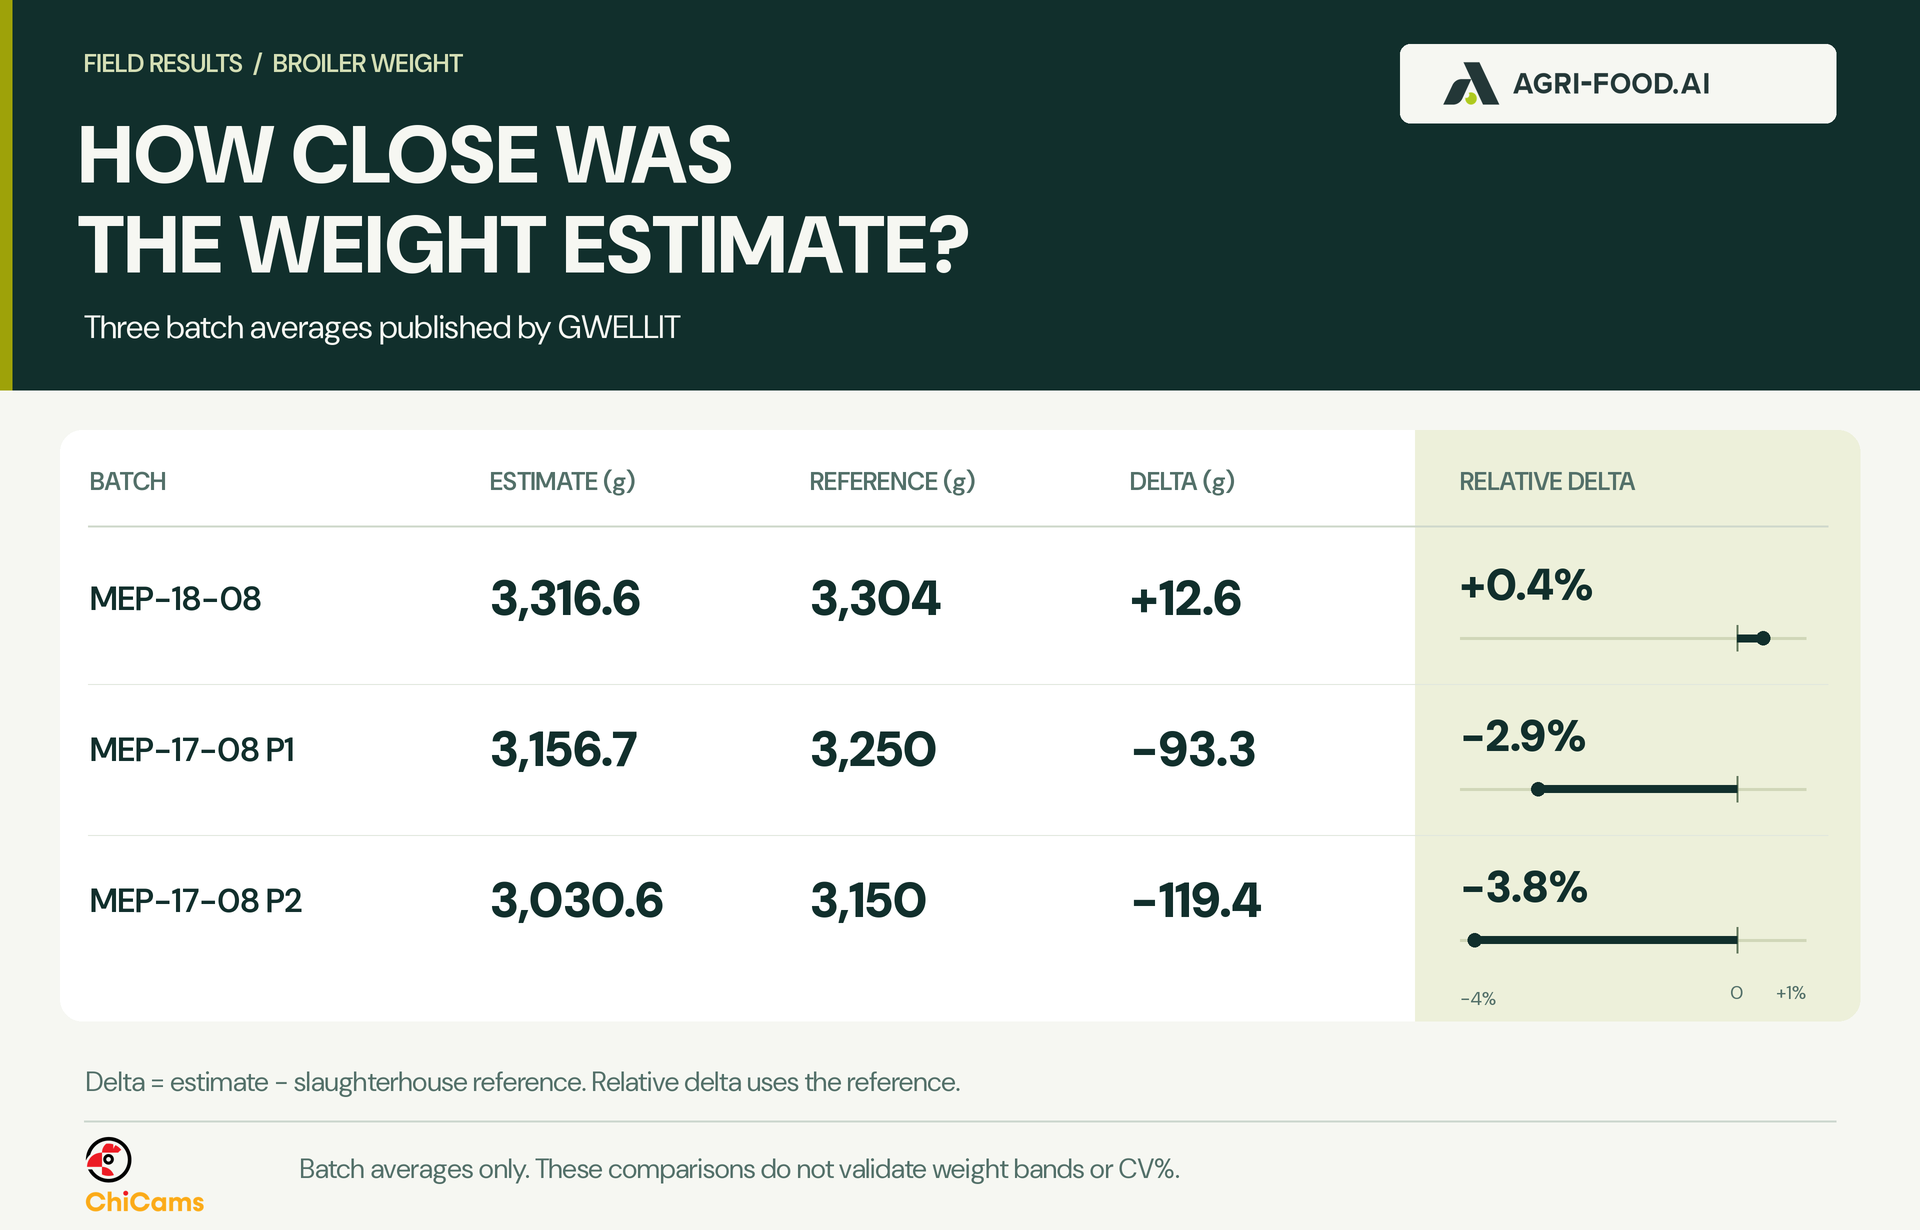
The partner post gives no precise camera timestamps or full weighing protocol. Therefore, use these results as batch-specific comparisons when discussing a local check. ChiCams also received a one-star Innov’SPACE 2025 award for innovation.
Check broiler weight distribution on your farm
Before collection, compare the camera records with individual physical weights from a suitable sample. Aviagen’s Ross Broiler Management Handbook 2025 recommends consistent weighing times, checked scales and sampling from at least three locations. Individual weights are necessary to assess the spread.
- Record the flock, date, time, sampling locations, bird count, individual weights, average and CV%.
- Then compare the sample with the camera estimate for a comparable period. Keep forecast values separate.
- After processing, check the batch average against the slaughterhouse record. Confirm whether it reports live or carcass weight, and when it was measured. Compare averages on the same basis. Assess individual bands only if comparable individual reference weights are available.
MoniTwin supports reference-weight entry and Excel export. Use those records to investigate differences across cycles. See the ChiCams system overview for the product workflow, and discuss the average and spread with your processing partner before agreeing collection.

Share your house layout and flock records to discuss a local ChiCams comparison.
2026-11-11


 Our website uses cookies